Ciencia, Ingenierías y Aplicaciones, Vol. 7, No. 1, enero-junio, 2024 ISSN (impreso): 2636-218X • ISSN (en línea): 2636-2171
LINEAR VANTENNA ARRAY DESIGN FOR NOAA SATELLITES
Diseño de antenas lineales V para satélites
DOI: https://doi.org/10.22206/cyap.2024.v7i1.3126
CRISTIAN C. CUERVO CALLEJASa, DAVID S. GUTIÉRREZ MONROYb, JUAN S. JIMÉNEZ CRUZc, CESAR M. GALARZA B. dY HERNÁN PAZ PENAGOSe
Recibido: 23/04/24 • Aceptado: 8/05/24

How to cite: Cuervo Callejas, C. C., Gutiérrez Monroy, D. S., Jiménez Cruz, J. S., Galarza B., C. M., Paz Penagos, H. (2024). Linear V antenna array design for NOAA satellites. Ciencia, Ingenierías y Aplicaciones, 7(1), 89–102. https://doi.org/10.22206/cyap.2024.v7i1.3126
Abstract
The article presents the design and construction of a miniature earth station with a V-shaped linear antenna array to acquire and decode NOAA 18 satellite signals in real-time. The objective is to obtain satellite images in the VHF band. The results of this work show a good-quality image when using the NOAA-APT decoding program and bandpass filtering. The interface between the radiating system and the USRP shows an acceptable level of coupling with a VSWR of 1.5 and return loss of -14 dB at the end, the adverse factors that did not allow better results are explained, among which the most important being the mutual impedance coupling of the antenna array and the information transmission time of 10 minutes from the NOAA 18 satellite.
Keywords: V antenna; NOAA satellites; weather information; image in APT format; digital filters.
Resumen
El artículo presenta el diseño y construcción de una estación terrena en miniatura con un conjunto de antenas lineales en forma de V para adquirir y decodificar señales del satélite NOAA 18 en tiempo real. El objetivo es obtener imágenes de satélite en la banda VHF. Los resultados de este trabajo muestran una imagen de buena calidad al utilizar el programa de decodificación NOAA-APT y filtrado de paso de banda. La interfaz entre el sistema radiante y la USRP muestra un nivel aceptable de acoplamiento con un VSWR de 1.5 y pérdida de retorno de -14 dB, al final, se explican los factores adversos que no permitieron mejores resultados, entre los cuales el más importante es el acoplamiento de impedancia mutua del conjunto de antenas y el tiempo de transmisión de información de 10 minutos desde el satélite NOAA 18.
Palabras claves: Antena V; satélites NOAA; información meteorológica; imagen en formato APT; filtros digitales.
1. Introduction
Meteorology is an interdisciplinary science that studies the weather and allows forecasting possible atmospheric eventualities such as weather, precipitation, etc. This meteorological information can only be collected by electronic systems in situ or by satellite telecommunications systems that orbit around the planet, which with high-resolution sensors capture atmospheric phenomena at a distance, convert them to an image, and transmit it by radio broadcasting. The NOAA (National Oceanic and Atmospheric Administration)-type satellite network is one such case. Abundant material on the design and construction of antennas for receiving stations used by NOAA services is found in the literature.
Reference (Fathurahman M. et al., 2019) designed and built a double cross dipole and a double V dipole, as omnidirectional antennas in the receiver, for the acquisition of satellite meteorological images; evaluated the performance of the antennas through return loss, VSWR and gain, and obtained return loss around -30 dB in both antennas and lower VSWR (of 1.063) and gain (5.2 dB) in the double V dipole. For their part, in (Rafsyam Y., Z. Indra, E. E. K. Jonifan, and W. A. Karimah, 2019), achieved less success in the performance of the double cross dipole that they designed and built for the same purpose in Indonesia; the authors of the article report a return loss of -18.9 dB, VSWR of 1.25, and gain of 3.8 dB with circular polarization. In (Argume A., R. Coaguila, P. Yanyachi, and J. Chilo, 2021) a satellite data acquisition system with an RTL SDR receiver, two antennas: Turnstile Crossed dipole with Balun and quadrofilar helical, designed at 137-138 MHz, Orbitron software, SDRSharp, WXTolmag and MatLab. The RTL-SDR receiver: RTL2832U, combined with the antennas and the software, forms the system for recording, decoding, editing, and displaying Automatic Picture Transmission signals in APT (Automatic Picture Transmission) format. The results show that the satellite image receptions are clear and descriptive enough for further analysis. While the system proposed by (Aniket K., B. Raghunath, N. Apurva, and G. Vinaya, 2022) deals with the hardware and software used during the decoding of images from NOAA satellites; The different challenges they faced during the construction process of a mini ground station and the solutions they came to overcome them are mentioned. In (Lin S. S., and Y. Z. Song, 2021) also developed a complete APT image processing and reception system based on low-cost software-defined radio RTL-SDR and Matlab; propose a linear regression method to estimate the length of each line in the
APT image, then apply interpolation to mitigate Doppler shift and noise; as a result, an APT image was successfully received and decoded. Finally, (Adeagbo E., W. Apena, and K. Akingbade, 2020) shows the design and implementation of a quadrofilar propeller antenna (QHA) for the reception of signals from meteorological satellites; Antenna optimization was performed by varying the element diameter, radial lengths, axial lengths, and materials of the elements in the adopted model. As a result, it is evident that the implemented QHA has a main lobe in accordance with the simulated QHA with a maximum gain of 10.75 dB at 0° and a half power beamwidth of 104°.
As evidenced in the review of the state of the art, the construction of mini earth stations for NOAA VHF satellite services is a simple academic experience to develop using SDR tools, and the main interest is focused on most of the works on experimenting with different antennas to achieve the best quality of the received image.
2. Framework
NOAA satellites, initially developed in the 1960s, detect daytime and nighttime weather information through real-time images on land (clouds, snow, ice, vegetation, etc.) and oceans (sea temperature), and transmit it automatically using an analog frequency modulated electromagnetic wave, continuous in range, free of charge, and free of license, and at frequencies of 137.9125 MHz and 137.10 MHz. Receiving a useful APT image from NOAA weather satellites usually takes at least 8 to 15 minutes within the range of the receiver, depending on the orbit and geographic location of the station. The user recovers the images through an audio file in APT format, which can be done through the WXToImg or NOAA-APT programs.
The APT format was developed by the National Earth Satellite Service of the United States. The image in the APT format (for NOAA 19 satellite) has the following characteristics: it covers areas from 2580 km2 to 700 km2, it has a resolution of 1.1 km at NADIR (point of the earth directly below the sensor, 4 km/ pixel in APT); the image is transmitted line by line continuously (similar to television).
The satellite in its normal operation (Fig. 1) informs about the current state of the local atmospheric conditions, which it detects by means of spectral sensors in the near and thermal infrared band; the system also allows to identify various phenomena such as desertification, deforestation, or large-scale fires, in addition to using them to map solar irradiation, surface temperature, and even land cover on a continental scale to carry out crop inventory.
Figure 1
NOAA satellite in normal operation (National Ocean Service, 2022)

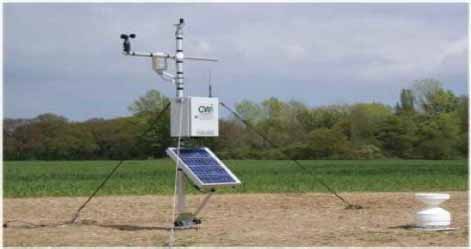
To detect an electromagnetic wave that is transmitted through free space and convert it into an electrical signal, it is necessary to use the antenna as a transducer (see Fig. 2). In the literature, different types of antennas are identified according to the number of elements that make them up (elementary antennas, antenna arrays), the operating frequency, the geometric configuration, the gain, bandwidth, etc. For the case that this investigation deals with, an array of linear antennas was chosen for the VHF (Very High Frequency) band.
Figure 2
Example of a weather antenna (Nyo2, 2021)
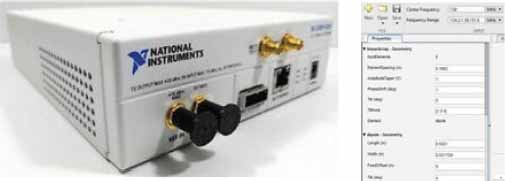
The receiving station that detects and processes the electromagnetic waves received from NOAA satellites is based on a USRP (Software Defined Radio Device), which through software provides the RF architecture (except for the antenna), to perform the demodulation and information processing. The USRP incorporates different combinations of host-based processors, FPGAs, and RF front ends; and, as shown in Fig. 3, it offers wide bandwidth and different applications with multiple inputs, multiple outputs, radar systems, and WiFi/LTE test stands.
Figure 3
National Instruments USRP for handling communication protocols (National Instruments Corp, 2021)
3. Metodology
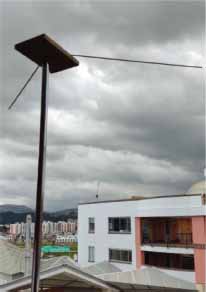
The design of the weather antenna was of the V-shaped arrangement of two half-wavelength dipoles for the VHF band; each element measures L/2 and they are separated by approximately 120°, to achieve a good reception of the modulated carrier signal. First, the working frequency of 138MHz was determined, which corresponds to the NOAA 18 satellite (height: 854 km, inclination 98.74°, period 102.12 minutes), which flies over the Colombian area. This design was made in the Matlab® "Antenna Designer" programming environment, specifically in the "Array Antenna Designer" to have two separate dipoles and generate the simulation of the omnidirectional radiation pattern and other antenna parameters; the circular polarization of the electric field, the bandwidth, the gain, the artificial ground plane, and the impedance matching with the transmission line were also considered. The dimension of the dipole L had the operating wavelength of 137 MHz as a reference. The effective length of the dipole is found using Eq. 1 while Fig. 4 shows the antenna built.
Figure 4
The array of linear antennas was built
The linear antenna array has an artificial ground plane, and the array elements have an effective length less than their physical length, through which the incident electromagnetic wave is induced to be converted to an electrical signal (AC voltage). This signal is conducted to the receiver through a 50 Ω SMA transmission line; in the receiver, it is amplified and processed to recover the information of interest. The demodulation of the FM signal was done with the USRP, adjusting some parameters for correct reception. The image was decoded using two programs: WXToImg and NOAA-APT.
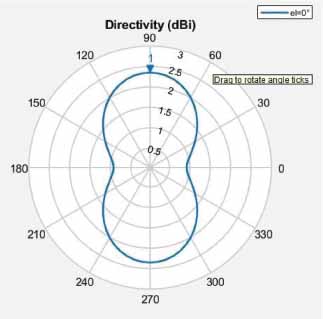
Before recovering the meteorological image that came encoded in APT format, the LabVIEW program was used to do bandpass filtering from 100 Hz to 4.16 KHz, centered approximately at 2.4 KHz. The goal was to remove the noise/interfering signals and recover the relevant information. Fig. 5 and Fig. 6 show some parameters of the designed antenna array: Gain of 5.56 dBi and beamwidth of 60°.
Figure 5
Radiation spectrum (E plane) of the antenna array
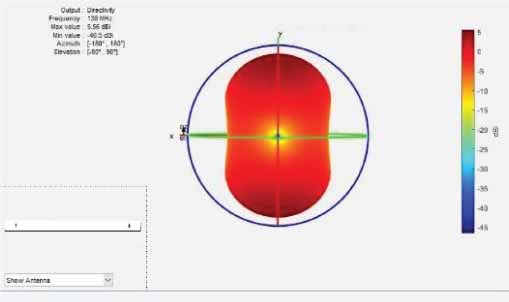
Figure 6
Directivity of the designed antenna array
Once the antenna array was designed and built, the reception tests of the modulated signals transmitted from the NOAA satellite were carried out (see Fig. 7). For the antenna development the number of times in which the satellites passed through the area where the ground station was located was considered [8].
Figure 7
NOAA satellite trajectories and antenna array location (National Ocean Service, 2022)
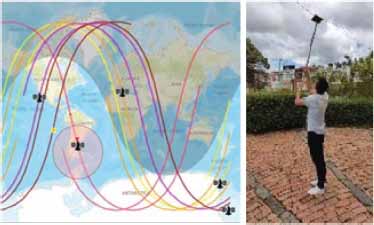
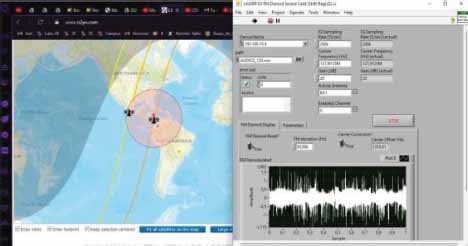
Fig. 8 shows the detection of the NOAA 18 satellite and the FM demodulation of the modulating signal: image in APT format. This signal is processed by LabVIEW to clean the noise and interference information.
Figure 8
Signal measurement with antenna and NOAA 18 satellite interception
4. Results
Through the quality of the image, it is inferred that the antenna arrangement was well selected, designed, and built. One aspect to be improved is the presence of background noise at link time. To solve the background noise problem of the received image (Fig. 9), the signal is filtered (Fig. 10) and then passed through the two decoding programs of the APT format: a low-quality image is obtained when it is decoded with the WXtoIMG program (Fig. 10), and it is compared with two references: the same image obtained from Google Earth (Fig. 11) and obtained from the official NOAA information source (Fig. 12). When the image is decoded in the NOAA-APT program (Fig. 13) a good-quality color image is obtained.
Figure 9
Filter used to improve the quality of the audio obtained
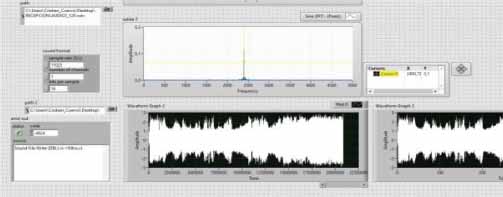
Figure 10
Image obtained through the WXToIMG program

Figure 11
Image obtained from Google Earth

Figure 12
Image obtained from the official NOAA satellite information. From [9, 10]

Figure 13
The resulting image was obtained from the NOAA-APT program and after the filter

It is worth mentioning that the filter has some specific characteristics: bandpass, centered at 2.4 kHz. The received RF signal had a carrier of 138.9125MHz, but its modulating or information signal was with AM modulation and sub-carrier at 2.4kHz. The antenna can also work on the frequency 137.62 and 137,912 to receive NOAA 15 and 18.
The results show that the image is sufficiently clear and descriptive, although there are frequency deviations of the signal modulated by Doppler shift that affects noise and distorts its quality. Other factors that affected the quality of the received image were: a slight impedance mismatch between the mutual impedance of the antenna array (41 Ω) with the impedance of the transmission line (50 Ω); poor quality of the connections from the line to the antenna; unstable conditions of the place at the moment of making the measurements; limited effective length of array elements (L/2); amateur radio communications jamming signals; background noise present during the reception time of 10 minutes; misalignment between the ground station antenna with the satellite (the satellite is not within the full range of the receiver) and the narrow-bandwidth FM modulated signal from the NOAA satellite.
5. Conclusions
As a result of this work, we have constructed a V-shaped antenna arrangement of two half-wavelength dipoles for the VHF band to obtain meteorological signals - images. The design is based on a mathematical analysis and later simulated in Matlab. Finally, the construction of the antenna is carried out and field tests are carried out that allow verifying the operation of the system. The background noise problem in the obtained image was minimized by the bandpass filtering strategy carried out with LabVIEW. Other factors, which, despite efforts to minimize their deleterious effects, remain and deteriorate image quality, are the level of impedance mismatch (VSWR=1.5) and return loss (-14 dB) at the interface. linear antenna array with the USRP, as well as the power level received from the NOAA satellite.
The L/2 length of the array elements contribute to the gain of the antenna array; however, the mutual impedance of 41 Ω and the separation angle of the array elements (120°) do not guarantee the reception of electromagnetic waves with pure circular polarization.
For future work, it is recommended to improve the radiant system against return losses. Since, although they find an average value of -14 dB, which is acceptable, the power losses could be further minimized. The variation of the VSWR depends on the variation of the traveling waves present in the radiating system, but mainly on the reflected wave. In practical terms, antennas in poor condition, damaged power cables, a badly made connector, an oxidized antenna port or a bad fit in the splice of two connectors, losses in a coupler, and other errors in the operation and operation make the impedance of the transmission line varies throughout its length. At the same time, it will cause the reflected wave to increase, so the value of VSWR will also increase. Another cause of the variation of VSWR with the length of the transmission line is the bad artificial grounding of the antenna.
References
Adeagbo E., Apena, W., & Akingbade, K. (2020). Quadrifilar helix antenna for weather satellite reception. Journal of Engineering Studies and Research, 26(3), 7-18. https://doi.org/10.29081/jesr.v26i3.202
Aniket K., Raghunath, B., Apurva, N., &Vinaya, G. (2022). Real-time Decoding of Satellite Signals. IEEE North Karnataka Subsection Flagship International Conference, Indian. https://doi.org/10.1109/NKCon56289.2022.10126774
Argume A., Coaguila, R., Yanyachi, P., & Chilo, J. (2021). NOAA Image Data Acquisition to Determine Soil Moisture in Arequipa-Perú. IEEE Transactions on Nuclear Science, 68(8), 1-11. https://doi.org/10.1109/TNS.2021.3087351
Fathurahman M. et al., (2019). Design and Development of Dipole Antenna for NOAA Satellite Image Acquisition System and Processing. First Workshop on Engineering, Education, Applied Sciences, and Technology Journal of Physics: Conference Series 1365. https://doi.org/10.1088/1742-6596/1364/1/012025
Lin S. S., & Song, Y. Z. (2021). A Doppler Effect Correction Method for APT Weather Satellite Image Reception. 2021 International Symposium on Intelligent Signal Processing and Communication Systems (ISPACS), Hualien City, Taiwan, pp. 1-2. https://doi.org/10.1109/ISPACS51563.2021.9651104
National Instruments Corp. (2021). Dispositivo de Radio Definido por Software USRP. NI. https://www.ni.com/es-co/shop/hardware/products/usrp-software-defined-radio-device.html
National Ocean Service (2022). NOAA’s 200 years of historical resources: AVHRR. https://celebrating200years.noaa.gov/resources.html
Nyo2 (2021). How Many Satellites Can We Safely Fit in Earth Orbit? https://www.n2yo.com/?s=33591|25338|27453|28654|41069
Rafsyam Y., Indra, Z., Jonifan, E. E. K., & Karimah, W. A. (2019). Design of Double Cross Dipole Antenna as NOAA Satellite Signal Receiver for Monitor Cloud Conditions Application. Journal of Physics: Conference Series. https://doi.org/10.1088/1742-6596/1364/1/012059
_______________________________
a Faculty of Electronic Engineering, USTA Tunja, Boyacá, Colombia.
Correo-e: cristian.cuervo@usantoto.edu.co
b Faculty of Electronic Engineering, USTA Tunja, Boyacá, Colombia.
Correo-e: david.guitierrezm@usantoto.edu.co
c Faculty of Electronic Engineering, USTA Tunja, Boyacá, Colombia.
Correo-e: juans.jimenezc@usantoto.edu.co
d Faculty of Electronic Engineering, USTA Tunja, Boyacá, Colombia.
ORCID: 0000-0002-0814-7483. Correo-e: cesarmgb@gmail.com
e Faculty of Electronic Engineering, University Escuela Colombiana de Ingeniería Julio Garavito, Bogotá, Colombia.
ORCID: 0000-0002-2692-1989