Ciencia, Ingenierías y Aplicaciones, Vol. 2, No. 1, enero-junio, 2019 ISSN (impreso): 2636-218X • ISSN (en línea) • Sitio web: https://revistas.intec.edu.do/
Probabilistic seismic hazard analysis and design earthquake for Santiago, Dominican Republic
Análisis probabilístico de riesgo sísmico y terremoto de diseño para Santiago, República Dominicana
Area de Ingeniería. Instituto Tecnológico de Santo Domingo (INTEC). Correo-e: Kalil.Erazo@intec.edu.do

Cómo citar: Erazo, K. (2019). Análisis probabilístico de riesgo sísmico y terremoto de diseño para Santiago, República Dominicana. Ciencia, Ingenierías y Aplicaciones, 2(1), 67-84. Doi: https://doi.org/10.22206/cyap.2019.v2i1.pp67-84
Resumen
This article presents the results of a probabilistic seismic hazard analysis (PSHA) conducted for a site in the city of Santiago, located in the Dominican Republic. To perform the PSHA recent seismological data of the Septentrional fault (seismic source) is used to calibrate an earthquake recurrence model, and to compute the seismic hazard curves of several earthquake, ground motion, and structural response parameters of interest in earthquake engineering applications. The parameters studied include horizontal peak ground acceleration and 5 % damping pseudo-acceleration response spectrum ordinates. The effect of uncertainty in the seismic fault rupture zone location is studied using a Monte Carlo analysis; for this purpose, the rupture location is treated as a random variable along the fault. The PSHA results are compared to the site design response spectrum with 2 % exceedance probability in 50 years specified in the Dominican Republic building code. It is concluded that there is a 17 % probability that the actual 2 % exceedance spectrum ordinates are greater than those specified in the design spectrum due to uncertainties related to the attenuation law employed to relate earthquake source and ground motion characteristics at the site. Based on the attenuation model, the design spectrum at the site is consistent with the spectrums generated by a 7.9 (moment) magnitude earthquake, which is close to the 7.8 magnitude characteristic earthquake estimated in previous studies for the Septentrional fault.
Palabras clave:
Abstract
Este artículo presenta los resultados de un análisis probabilístico de peligro sísmico (APPS) llevado a cabo para un lugar en la ciudad de Santiago, localizada en la República Dominicana. Para realizar el APPS se utilizaron datos sismológicos recientes de la falla Septentrional (fuente sísmica) para calibrar un modelo de recurrencia de terremotos y para calcular las curvas de peligro sísmico de varios parámetros de terremotos, movimiento del suelo y respuesta estructural de interés en aplicaciones de ingeniería sísmica. Los parámetros estudiados incluyen aceleración horizontal pico del suelo y ordenadas del espectro de pseudo-aceleración, con 5 % de amortiguamiento. El efecto de la incertidumbre en la ubicación en la falla de la zona de ruptura es estudiado usando un análisis de Monte Carlo; con este propósito la ubicación de la ruptura se trata como una variable aleatoria en la dirección de la falla. Los resultados del APPS son comparados con el espectro de diseño del sitio con 2 % de probabilidad de excedencia en 50 años, especificado en el código de la República Dominicana. Se concluye que hay un 17 % de probabilidad de que el valor actual de las ordenadas espectrales con 2 % de excedencia sea mayor que el valor especificado en el espectro de diseño, debido a las incertidumbres relacionadas a la ley de atenuación usada para relacionar la fuente de terremotos y las características del movimiento del suelo en el lugar. Basado en el modelo de atenuación, el espectro de diseño en el sitio es consistente con los espectros generados por terremotos de magnitud (momento) de 7.9, lo cual es cercano al terremoto característico de magnitud de 7.8 estimado en estudios anteriores de la falla Septentrional.
Keywords:
1. Introduction
Characterization of the earthquake-induced strong ground motions expected at a site is a fundamental problem in earthquake engineering. The expected strong ground motion characteristics (such as intensity, duration, and frequency content) are needed for the effective analysis and design of structures to withstand earthquakes. Current practice in the design of earthquake-resistant structures is based on allowing the structure to sustain a prescribed level of damage during strong earthquakes without major failure or collapse; the expected level of damage might be severe and perhaps irreparable. The reasoning for this is that it is usually economically unfeasible to design structures to resist strong earthquakes without sustaining any damage, since the mean recurrence of such rare event implies that there is a low probability that a given structure will be affected by a major earthquake during its lifetime.
The estimation of the potential seismic ground motion characteristics for the seismic design of structures is known as a Seismic Hazard Analysis (SHA). In general, this process entails the following steps (Villaverde, 2009)
- Identification and characterization of earthquake sources (seismic faults) near a site.
- Estimation of the frequency of earthquakes of different magnitudes that can be generated at the sources.
- Evaluation of the distance and orientation of the site with respect to the sources.
- Development and/or application of empirical relationships (attenuation laws) that relate source characteristics to ground motion characteristics at the site.
Thus, a seismic hazard analysis can be divided in two main steps: source characterization and ground motion characterization. It should be pointed out that forecasting the characteristics of future earthquakes at a site is a challenging task due to the uncertainties involved in modeling the earthquake initiation and propagation mechanisms and the lack of sufficient seismicity data (especially of strong earthquakes) needed to calibrate both physics-based and statistical models. To account for the uncertainties involved in estimating the ground motion characteristics at a site a probabilistic framework where uncertain variables are treated as random variables is generally employed (Cornell, 1968). When a probabilistic framework is used to estimate seismic parameters at a site the resulting approach is known as a Probabilistic Seismic Hazard Analysis (PSHA). PSHA is the main tool used in practice to estimate the ground motion characteristics and design earthquake in earthquake-prone regions. In this regard, the design seismic loads delineated in most civil engineering design codes and standards (such as ASCE-07, EUROCODE 8 and IBC) are specified based on the results of a PSHA.
This article presents a PSHA for a site located in the center of the city of Santiago (Dominican Republic). Santiago is a densely populated city of the Dominican Republic located in the northern region of the Hispaniola island, and given the characteristics of its built environment and closeness to an active seismic fault can be arguably considered the location of highest seismic risk in the Dominican Republic. The site of interest and the seismic faults of the Hispaniola island are shown in figure 1, where “SFZ” denotes the Septentrional fault, the active seismic fault closest to the site. Recent research work suggests that the Septentrional fault might be in the late phase of its rupture cycle (Calais et al., 2002), and for this reason it is of interest to characterize the potential ground motion characteristics at densely populated sites close to it.
A PSHA is performed herein using parameters obtained from recent seismicity data, such as slip rate estimated using global positioning systems (Calais et al., 2002; Frankel, Harmsen, Mueller, Calais & Haase, 2010). The estimated ground motion characteristics include horizontal peak ground acceleration (PGA) and 2 % damping pseudo-acceleration (PSA) response spectrum ordinates. The rest of the paper is organized as follows. In the next section the earthquake sources are briefly discussed, followed by the recurrence model employed. Then, the magnitude exceedance curves for several exposure times are presented and used as the basis to estimate ground motion intensity parameters for various exceedance probabilities. Finally, the effect of the rupture zone location in the fault is studied, followed by concluding remarks.
2. Earthquake sources (seismic faults) near Santiago
The city of Santiago is located in the northern region of the Hispaniola island, delimited by the Septentrional fault to the north and the Hispaniola fault to the south (see figure 1). Based on strain measurements of the Hispaniola faults, using a global positioning system (GPS), the seismic hazard of Santiago is dominated by the Septentrional fault (Calais, 2002). For this reason, in this paper the Septentrional fault will be considered the only earthquake source.
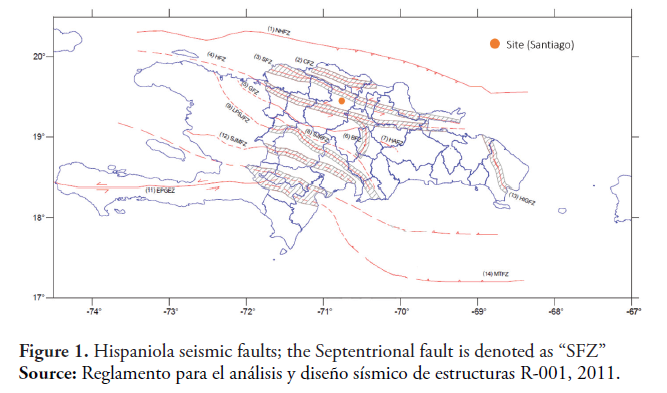
The Septentrional fault is a left-lateral strike-slip fault that crosses the northern region of the Hispaniola (Dominican Republic), and accommodates part of the motion between the North America and Caribbean plates; it is worth to point out that this motion between the North America and Caribbean plates caused the devastating 2010 Haiti earthquake. Trenches excavated in the area and radiocarbon analyses showed that the fault has accumulated at least 5m of deformation, and that the most recent severe surface rupture in the central portion of the fault (closest to Santiago city) occurred before 1260 (Mann, Prentice, Burr, Peña & Taylor, 1998). Although a small portion of the accumulated strain energy was released during the 1562, 1776, 1783 and 1842 earthquakes, the consensus is that the return period of the characteristic earthquake has been exceeded (Frankel et al., 2010; Isidro et al., 2017). The slip rate of the Septentrional fault is estimated to be 12mm/year, and the characteristic magnitude or maximum magnitude of rupture is estimated to be 7.8 (Calais et al., 2002; Frankel et al., 2010).
3. Magnitude-Recurrence Model
The potential of a fault to generate strong earthquakes can be partially quantified using the mean annual rate of exceedance defined as the ratio of the number of earthquakes of (moment) magnitude greater than , divided by the time interval under consideration. Using information on fault slip rates, historical and instrumental seismicity, the estimated mean exceedance annual rates for the Septentrional fault and magnitudes m=6.5 and m=7 are (Frankel et al., 2010)
where denotes the corresponding return periods or mean recurrence intervals. Traditionally, the Gutenberg-Richter (GR) equation is used to model the magnitude-recurrence relationship of earthquakes in a region. In this model the relationship between annual rate of exceedance and earthquake magnitude is given by
(1)
Where a and b are model parameters, and m is the earthquake (moment) magnitude. Using the exceedance rates found by Frankel et al., (2010), the GR calibrated model parameters are a = 3.91 and b = 0.86. The Gutenberg-Richter model implies that the probability distribution of earthquake magnitude at the site is exponential.
The Gutenberg-Richter model is unbounded and forecasts higher rates than observed in practice for large earthquakes. The GR model can be modified to include a lower and upper threshold to limit the earthquake magnitude to a range of interest in applications. In the bounded GR model, the mean annual rate of exceedance is given by (Youngs & Coppersmith, 1985).
(2)
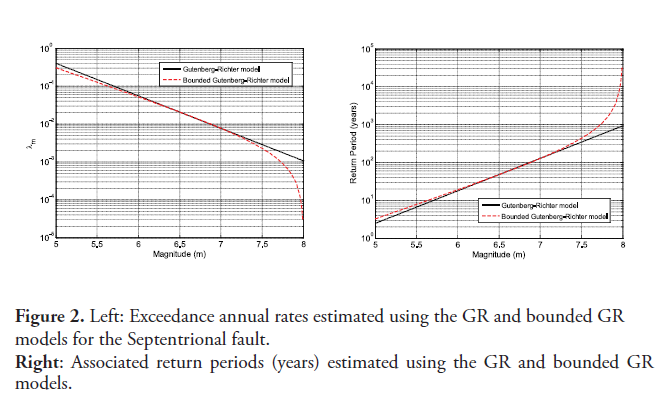
Resulting on a truncated exponential probability model for earthquake magnitude. To calibrate a bounded GR model for the Septentrional fault the maximum magnitude was selected =8, based on results obtained in Frankel et al. (2010), while the lower magnitude threshold was set on . Using the exceedance rates discussed before, for the Septentrional fault the bounded GR model parameters are and . figure 2 depicts a comparison of the exceedance rates estimated using the previous models. As can be seen, the standard GR model forecasts rates significantly larger than the bounded model for earthquakes of magnitude greater than 7.5; the figure also shows the return period (mean recurrence interval) estimated by both models. The bounded GR model is adopted herein to characterize the relationship between earthquake magnitude and recurrence.
4. Exceedance curves of earthquake magnitude in a given time interval
The magnitude-recurrence models discussed in the previous section allow to estimate the earthquake magnitude probability distribution and the rate of occurrence of earthquakes at a site at any time, i.e., the time interval is unbounded. In other words, the model characterizes earthquake occurrence in space. For structural engineering application purposes, it is of interest to characterize the potential occurrence of earthquakes in a given time interval that involves the lifetime of a structure (e.g., 50 years, 100 years, 500 years, etc.), i.e., a temporal characterization of earthquake occurrence. After the lifetime of the structure is set, the objective is to find the probability of exceeding a ground motion parameter (typically magnitude, peak ground acceleration or response spectra) in order to design the structure for a parameter value with “small” probability of being exceeded during its lifetime.
Setting a time interval for the lifetime of a structure (also known as design life or exposure time) implies that a model for earthquake occurrence in time is needed. The Poisson process is usually used to model events related to earthquake occurrence in time. In this model the number of occurrences XT of an event in the time interval [0,T] is modeled as a random variable with probability distribution
(3)
Where λ is the mean annual rate of the event, XT and T is the time interval in years. The mean and variance of the random variable XT is λT. The event XT can be, for example, the number of earthquakes that exceed a given magnitude, or the number of times that a response parameter (such as peak ground acceleration or pseudo-acceleration response spectrum ordinates) exceeds a given value. The exceedance probability (EP) is defined as the probability that the event XT occurs at least one time in the time interval and is given by
(4)
The return period of an event with exceedance probability EP is given by
(5)
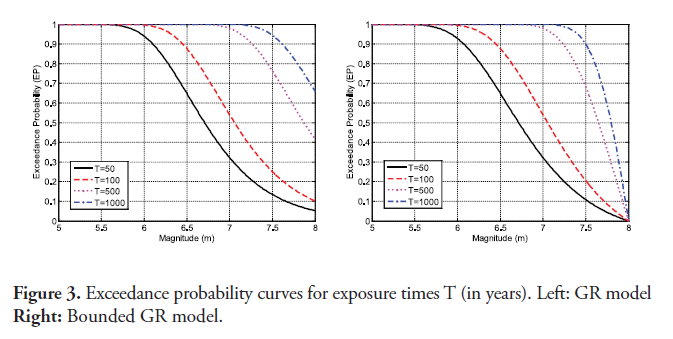
The exceedance probability for earthquake magnitude is depicted in figure 3 for annual rates estimated by both the GR model and the bounded GR model for several exposure times; curves of this type are known as Seismic Hazard Curves. As can be seen, for earthquake magnitudes greater than 7 the exceedance probabilities estimated using the (unbounded) GR model are significantly larger than those estimated using the bounded GR model.
Based on the bounded GR model, an earthquake of magnitude m=7.9 has a 2 % exceedance probability in 50 years (return period of 2475 years), while an earthquake of magnitude m=7.5 has a 10 % exceedance probability in 50 years (return period of 475 years). The characteristic earthquake of the Septentrional fault was estimated to be 7.8 (Frankel et al., 2010), and thus has an exceedance probability of approximately 3.3 % in 50 years or a return period of 1460 years.
It is worth to point out that modeling earthquake occurrence as a Poisson process contradicts the physical processes by which earthquakes are generated, and the elastic rebound theory generally used to explain the phenomena since it assumes that earthquakes generated at a source are independent of each other. Given the strain energy accumulation and release mechanisms that take place in a fault, there is a strong time correlation (clustering) among consecutive earthquakes. This implies that the mean occurrence rate is time-dependent, a behavior that can be modeled using the Omori power law (Omori, 1895; Utsu, Ogata & Matsuura, 1995). Although some researchers argue that the discrepancy between the physics and statistical models are enough to render PSHA essentially useless when trying to predict earthquake characteristics (Mulargia, Stark & Geller, 2017), recent studies have tested the results of PSHA and show that they are consistent with observations (Kammerer & Ake, 2012). Moreover, recent recurrence models aim to account for time-dependent behavior which is one of the main theoretical limitations of PSHA (HERP, 2010).
5. Ground motion intensity parameters at the site
Experience has shown that the characteristics of earthquake-induced ground motions vary significantly for different earthquakes and sites. Moreover, the ground motion characteristics that have the most significant impact in the response of structures to earthquakes are duration, amplitude (intensity) and frequency content. The main factors that affect the aforementioned ground motion parameters are:
- Type of seismic fault, rupture depth, fault orientation and rupture direction with respect to the site.
- Earthquake magnitude, which in turn depends on the area of the ruptured zone, the fault displacement, and shear modulus of the rock adjacent to the fault.
- Characteristics of propagation medium, local soil properties and topography
Given the difficulty to quantify the impact of these factors in the ground motion using an analytic (mechanics-based) model, empirical models (also known as attenuation laws) are developed using regression analyses and past seismicity data in order to estimate the ground motion characteristics and their effect in the behavior of structures.
When enough data is available an attenuation law can be developed for the specific site of interest. However, usually this is not the case and an attenuation law of the existing literature needs to be adopted. Given the scarcity of strong ground motion data for events in the Dominican Republic region, the Campbell equations for shallow crustal earthquakes in active regions are adopted herein as an attenuation model to estimate the ground motion characteristics at a site in the city of Santiago. The ground motion parameters include peak (horizontal) ground acceleration and 5 % damping pseudo-acceleration response spectrum. The equations proposed by Campbell are based on worldwide data of shallow earthquakes of magnitudes between 4.7 and 8.1, and stations on sites overlying deposits of at least 10m of firm soil or soft/hard rock (Campbell, 1997).
The parameters used in the Campbell model to estimate ground motion properties at the site are:
r = shortest distance to the zone of potential seismogenic rupture = 8 km
D = depth to basement rock = 3 km
F = seismic fault factor = 0 (strike-slip fault)
SSR = soil type factor = 0 (alluvium/firm soils)
SHR = soil type factor = 0 (alluvium/firm soils)
The shortest distance to the zone of seismogenic rupture was selected based on a site in the center of Santiago, while the depth to basement rock was selected based on results of previous geotechnical studies. The soil parameter was selected as firm soil since this is the type of soil predominant in the area.
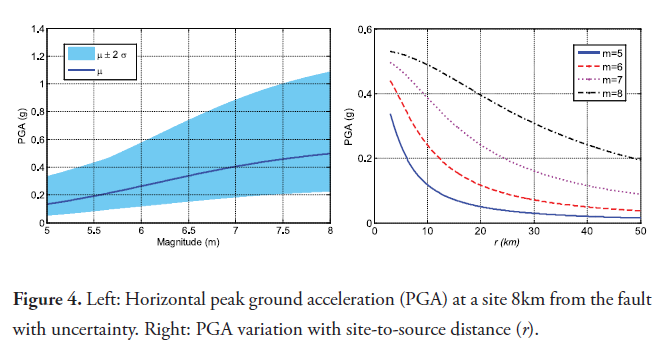
The mean peak ground acceleration (PGA) estimated with the Campbell attenuation law at a site in the city of Santiago, located approximately 8 km away from the closest point to the seismogenic rupture zone in the Septentrional fault, is shown in the left panel of figure 4. The figure also shows the PGA uncertainty characterized by two standard deviations; since the PGA is modeled as a lognormal distribution, the uncertainty is represented as the standard deviation of the associated normal distribution. This uncertainty is mainly related to the uncertainty in the forecast due to the attenuation law employed. The right panel of figure 4 illustrates the variation of the mean PGA with magnitude and distance according to the Campbell attenuation law.
It should be noted that the distance (r) is the shortest distance from the site to the potential seismogenic rupture zone. However, an earthquake can occur throughout the length of the active fault region. The effect of the potential location of the rupture zone considering the possibility that the rupture does not occur at the closest point to the site will be considered in a further section of this paper.
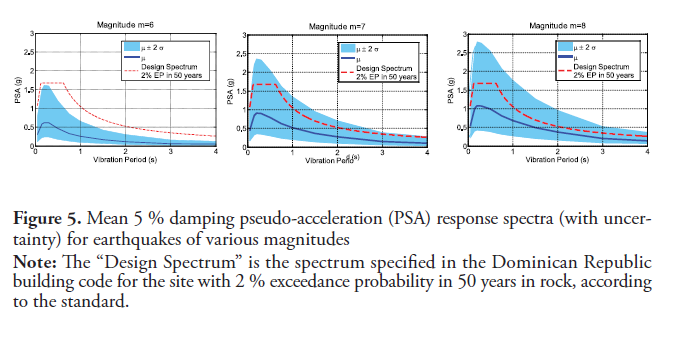
The estimated mean 5 % damping pseudo-acceleration response spectra are shown in figure 5 for various earthquake magnitudes; the uncertainty bounds defined by two standard deviations are also depicted in the figure where, as before, the response spectra ordinates are lognormal random variables and the mean and standard deviation shown are those of the underlying Gaussian distribution. For comparison purpose, the design spectrum with 2 % exceedance probability in 50 years for firm soil specified in the Dominican Republic building code for the site of interest is also shown in the figure.
5.1. Exceedance curves of ground motion parameters at a site in a time interval (exposure time)
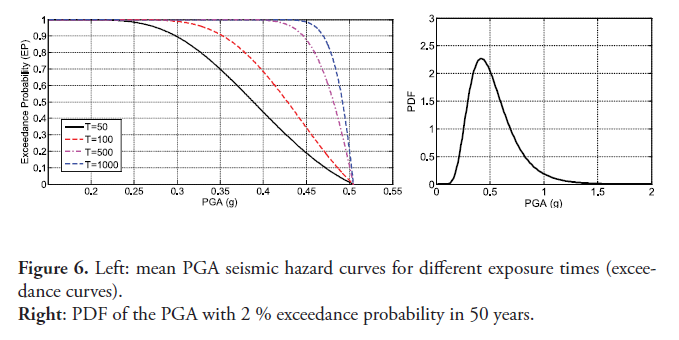
The exceedance probability curves (seismic hazard curves) for different ground motion parameters of interest in earthquake engineering applications are presented next. The seismic hazard curves are obtained from an analysis based on the Campbell attenuation law and the bounded GR model discussed in previous sections. The left panel of figure 6 shows the exceedance probability for the mean PGA and several exposure times. The mean PGA with 2 % and 10 % exceedance probabilities in 50 years are, respectively, 0.49g and 0.47g. The right panel of figure 6 depicts the probability density function (PDF) of the PGA with a 2 % exceedance probability in 50 years, which based on previously recorded data of strong ground motions is usually modeled as a lognormal distribution. The uncertainty in the PGA with 2 % exceedance probability in 50 years observed in figure 6 is related to the attenuation law, i.e., the inherent variability in the measured response at a site due to fault and rupture mechanisms, propagating medium properties, local site properties, among others. Based on this PDF there is a 3.6 % probability that the PGA with 2 % exceedance probability in 50 years is greater than 1g.
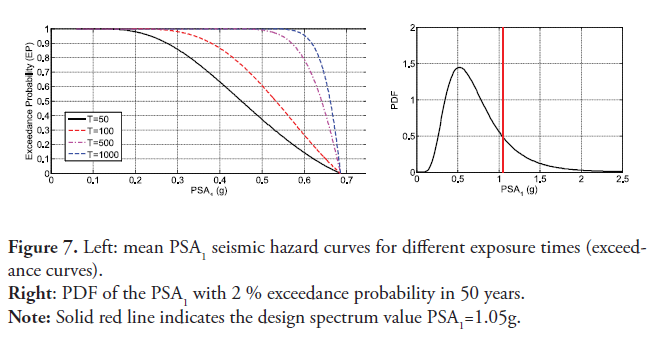
The left panel of figure 7 shows the exceedance probability for the mean 5 % damping pseudo-acceleration response spectra for 1 s vibration period (PSA1) for several exposure times; this quantity is typically denoted S1 in design codes and is used to construct the design response spectrum. The mean PSA1 with 2 % and 10 % exceedance probabilities for a return period of 50 years are, respectively, 0.65g and 0.62g. The right panel of figure 7 depicts de probability density function (PDF) of the PSA1 with a 2 % exceedance probability in 50 years. The uncertainty is related to the attenuation law employed. Based on the PSA1 PDF there is a 17 % probability of exceeding the code-specified value.
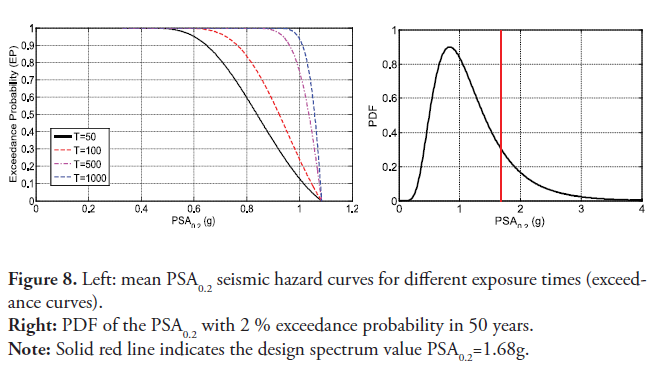
The left panel of figure 8 shows the exceedance probability for the mean 5 % damping PSA response spectra at short period defined herein as PSA0.2 for several exposure times; this quantity is typically denoted Ss in design codes and it is used to construct the design response spectrum. The mean PSA0.2 with 2 % and 10 % exceedance probabilities for a return period of 50 years are, respectively, 0.65g and 0.62g. The right panel of figure 8 depicts the PDF of PSA0.2 with a 2 % exceedance probability in 50 years. The uncertainty is related to the attenuation law used. Based on the PSA0.20 PDF there is a 17 % probability of exceeding the code-specified value.
5.2. Effect of location of rupture zone
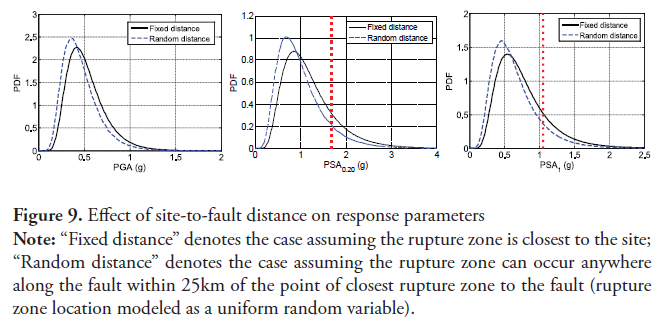
The results presented in the previous section assumed a rupture location at the point in the fault that is closest to the site, i.e., the smallest possible seismogenic distance from the source to the site. However, a seismic rupture can occur throughout the length of the fault, and not necessarily at the closest point to the fault. In this section we consider the rupture location as a uniform random variable with a maximum distance of 25km measured from the point of shortest seismogenic distance along the length of the fault.
For this purpose, a Monte Carlo analysis was performed to estimate the response quantities PDF modeling the rupture location as a uniform random variable. In this case the seismogenic distance r is given by
(6)
where U is the uniform random variable U(-25,25). A sample of 300,000 uniform variates where used to perform the Monte Carlo analysis. figure 9 presents the estimates of PGA, PSA1 and PSA0.20 for both the shortest distance (U = 0) and the random distance model. As expected, the distributions obtained considering the rupture location as random show a shift to the left; in addition, the results are not significantly sensitive to the location of the rupture zone. For comparison purposes the corresponding values in the design spectrum are also presented.
6. Conclusions
This article presented the results of a PSHA for the city of Santiago, located in the Dominican Republic. To perform the analysis recent seismicity data of the Septentrional fault (closest to the site) was used to calibrate a bounded Gutenberg-Richter earthquake recurrence model, and to compute the seismic hazard curves of several earthquake and structural response parameters. The parameters studied included horizontal peak ground acceleration and 5 % damping pseudo-acceleration response spectrum ordinates. In addition, the effect of uncertainty in the seismic fault rupture zone location was studied using a Monte Carlo analysis.
The PSHA results were compared to the site design response spectrum with 2 % exceedance probability in 50 years specified in the Dominican Republic building code, and it was found that there is a 17 % probability that the actual 2 % exceedance spectrum ordinates are greater than those specified in the design spectrum due to uncertainties related to the attenuation law used. Based on the attenuation model, the design spectrum at the site is consistent with the spectrums generated by a 7.9 (moment) magnitude earthquake, which is close to the 7.8 magnitude characteristic earthquake estimated in previous studies for the Septentrional fault.
Acknowledgements
This research was partially supported by the Instituto Tecnológico de Santo Domingo (INTEC) and the Ministerio de Educación Superior Ciencia y Tecnología (MESCYT) through the FONDOCYT program. The support is gratefully acknowledged.
Referencias
Calais, E., Mazabraud, B., Mercier de Le´pinay, Mann, P., Mattioli, G., & Jansma, P. (2002). Strain partitioning and fault slip rates in the northeastern Caribbean from GPS measurements. Geophysical Research Letters, 29(18), 1856, doi: https://www.doi.org/10.1029/2002GL015397
Campbell, K. (1997). Empirical Near-Source Attenuation Relationships for Horizontal and Vertical Components of Peak Ground Acceleration, Peak Ground Velocity, and Pseudo-Absolute Acceleration Response Spectra. Seismiological Research Letters, 68(1), 154-179.
Cornell, C.A. (1968). Engineering seismic risk analysis. Bull. Seismol. Soc. Am., 58, 1583-1606.
Frankel, A., Harmsen, S., Mueller, C., Calais, E., & Haase, J. (2010). Documentation for initial seismic hazard maps for Haiti: U.S. Geological Survey Open-File Report 2010-1067, 12 p.
Headquarters for Earthquake Research Promotion (HERP) (2010). National seismic hazard maps for Japan 2010, Earthquake Research Committee (K. Abe, chair), Headquarters for Earthquake Research Promotion, available from www.jishin.go.jp/main/chousa/10yosokuchizu/index.htm (in Japanese).
Isidro, M., Belvaux, M., Bernández, E., Bertil, D., Fernández, J., Huerta, L., Lopera, E., Muñoz, S., & Roullé, A. (2017). Geología de Santiago de los Caballeros (República Dominicana) para el estudio de microzonación sísmica. SÉMATA, Ciencias Sociais e Humanidades, 29, 11-38.
Kammerer, A. and Ake, J. (2012). Practical Implementation Guidelines for SSHAC Level 3 and 4 Hazard Studies, NUREG-2117, U.S. Nuclear Regulatory Commission, Washington, D.C
Mann, P., Prentice, C., Burr, G., Peña, L., & Taylor, F.W. (1998). Tectonic geomorphology and paleoseismology of the Septentrional fault system, Dominican Republic. The Geological Society of America. doi: https://www.doi.org/10.1130/0-8137-2326-4.63
Ministerio de Obras Públicas y Comunicaciones (MOPC) (2011). Reglamento para el análisis y diseño sísmico de estructuras R-001. Santo Domingo, República Dominicana.
Mulargia, F., Stark, P. & Geller, R. (2017). Why is Probabilistic Seismic Hazard Analysis (PSHA) still used? Physics of the Earth and Planetary Interiors, 264, 63-75.
Omori, F. (1895). On the aftershocks of earthquakes. J. College Sci. Imperial Univ. Tokyo, 7, 111-200.
Utsu, T., Ogata, Y. & Matsuura, R.S. (1995). The centenary of the Omori formula for a decay law of aftershock activity. J. Phys. Earth, 43, 1-33.
Youngs, R.R. & Coppersmith, K.J. (1985). Implications of fault slip rates and earthquake recurrence models to probabilistic seismic hazard estimates. Bulletin of the Seismological Society of America, 75, 939-964.
Villaverde. (2009). Fundamental Concepts of Earthquake Engineering. Boca Raton, FL. EE. UU.: CRC Press, Taylor & Francis Group.